Maybe you already have a social media strategy and content strategy and plan in progress. Great! The next step is figuring out how you’ll measure it – to see if all that work is making a difference. Choosing metrics that matter to your business is the most important step. There’s not a one size fits all for measuring your success. So in this article, I’m sharing marketing KPI examples for blogs and websites, email marketing newsletters, e-commerce, social media and overall business KPIs.
I’m a broken record on this one, but one of the most important things to do before you begin any project is to ask: How can I measure this?
We need to know if what we’re spending time on is working. Sometimes measurement is on the easier side – like when we can calculate ROI (Return on Investment) using a template for channels like paid search. Other times it’s more challenging to calculate ROI – for social media and content marketing, marketing attribution is helpful.
I’m often asked for examples of good KPIs (Key Performance Indicator) and metrics – which is part of why I released my Fill-in-the-Blank KPI Dashboard Template
Buy now – to give you a structure to play with metrics. However, all businesses are not the same. While it’s super helpful to have a template to use, the first step is figuring out what metrics and KPIs matter to you. Here’s a quick look at how I track success.
Step 1: What are your goals?
As we talked about in the first part of this series – it always comes back to this. And most of our goals are revenue based when we dig deep enough. Yes, you want to grow your community – usually so people buy X eventually. Yes, you want to more followers on Facebook – so they find your blog – an then so they eventually buy X. Revenue is almost always the main goal (it is the definition of business after-all).
Combining the main goal (usually revenue) with a secondary goal (grow community etc). leads us to knowing what to measure.
Step 2: What are your most important marketing channels?
You can’t be everywhere and do everything. Decide what channels to focus on most (newsletter, blog, Facebook, Pinterest, Twitter, Instagram, Google+, YouTube etc.) If you’re trying to be everywhere – and maintaining seven social networks – you’re going to have a hard time really taking off and creating an awesome community in just a few of those channels.
Note: this doesn’t mean you can’t build out a basic presence so people can at least find you and for SEO purposes. Just be mindful of why you’re doing it and let people know where you’re most active. It’s ok to lead a quieter existence in some channels. For example, with Facebook changing so much in the past year, a few businesses and bloggers have made grand proclamations of anger and left Facebook – deleting their pages. I wouldn’t recommend to delete a channel as it may come back around as a more viable option later. Instead, set up a way to minimize your effort and also let your community know that they can find you more actively on Instagram or your newsletter etc.!
Step 3: What Marketing KPIs actually matter to your business?
The next step is figuring out what base metrics and KPIs matter to your business. There are a lot of marketing KPI examples, so you need to narrow down what works for your business.
One of the big things to remember is that “vanity metrics “- (like # of followers) might not be the most important metric, they are usually the building blocks for other metrics and KPIs. You need them to calculate the more important metric. Example: You need your # of followers to calculate a growth %!
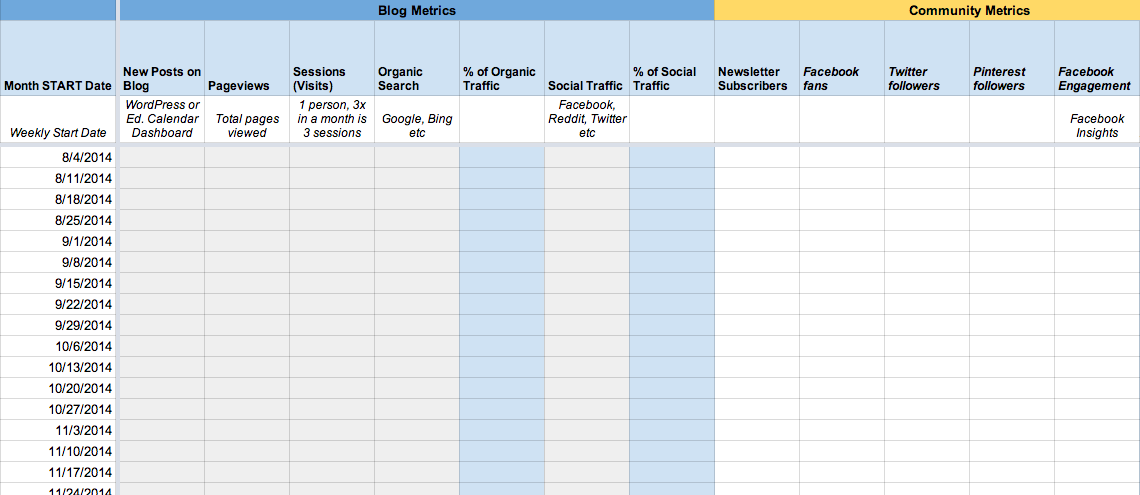
Blog and Website Marketing KPI Examples:
Google Analytics is chock full of metrics. Here are a few to give you month over month direction and insights.
- Traffic – this metric falls in line with “oh that’s nice” type, similar to # of followers on social media. It’s not always going to drive your day-to-day decisions or business, but it’s important to make sure you’re not driving off a cliff! Calculate: Google Analytics >> Audience >> Overview >> Sessions, Pageviews
- Referral Channels – this metric lets you know where people are coming from. You can also keep track of how these channels are growing. And in combination with Conversion Goals, this can be a super powerful way to learn about what channels you’re “best” at and what activities are contributing the most to your goals. Calculate: Google Analytics >> Acquisition>> Channels >> Organic Search, Direct, Social, Referral, Email etc.
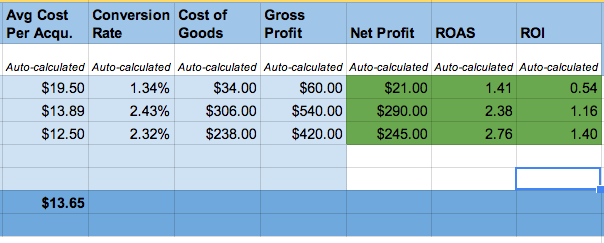
- Conversion – this metric isn’t just for e-commerce sites. Remember a conversion can be for a product/service or a desired action – like signing up for your newsletter. You’ll find this in Google Analytics >> Conversions >> Goals Calculate: [# of conversions] ÷ [# of Sessions] = Conversion Rate %
- More E-Commerce – there are a lot of other e-commerce metrics beyond conversion rate – from specific products, pricing, growth, new/old, channel, advertising etc.
- Most Popular Content – this metric gives us an idea of what is popular with our audience. It’s best to look at this from a few angles – SEO, community, social etc and see what you can learn. For example, just because your most popular post this month is driving a lot of traffic from organic search doesn’t mean you necessarily should create more similar content. Is it relevant content? Is it driving your goals or conversions? Remember to use the Date Range field in Analytics and check the “Compare to” box to see growth Calculate: Google Analytics >> Behavior >> Site Content >> All Pages
- Notes and stories – this metric is the anecdotal “quality over quantity” item. It’s really helpful to have an area in your Metrics tracking to report these little or big wins – the random stuff that’s worth mentioning. Did your referral traffic skyrocket from a random share or RT? Note it! Did you get contacted to guest blog or partner on a project? Note it! Did a customer leave a really great comment or review? Note it! These are also great items to share with the rest of your team to let them know what’s happening out there.
Social Media KPI Examples:
While many social media dashboards have included “insights”, it can be helpful to track important metrics outside of the specific channel to compare and also keep your data by a monthly/weekly view – it becomes more actionable.
- Engagement – this metric tells us how “active” or “participative” our audience is. Your number of followers or fans doesn’t mean much if they’re not doing anything or don’t care what you have to say. Facebook has an easy engagement stat already, but you can create your own or even combine this with Google Analytics data. Maybe your engagement is more about the community (including your brand) sharing your site and content. Calculate: [# of followers that “did” something] ÷ [# of followers] = Engagement Rate %
- Growth of Channel – this metric can sometimes seem like a vanity metric, but it’s an important snapshot of how quickly your community is growing month over month or week over week. Just beware that it can give you a false sense of success, especially if you’re paying (Facebook ads etc.) I’m a believer in tracking this one though, as it can usually give you some ideas of further testing. For example: huge growth this month? What did you do differently? Did revenue grow with it? See a decline? Did you stop or start anything new? Calculate: [# of followers] – [# of followers last month] ÷ [# of followers last month] = Growth %
- Referral Traffic – this metric lets you know if you’re even driving people back to your website or blog. If your engagement is high (from likes, comments etc), but you’re never getting anyone to come back to your website, you’re missing a big part of the picture. Calculate: Google Analytics >> Acquisition>> Channels >> Social >> Twitter, Pinterest, Facebook Google+ etc.
- ROI Attribution – this metric is more typical if you’re selling something or doing a paid campaign (Facebook ads, Twitter ads etc.) You can also calculate how well you’re achieving your ad goal (likes, clicks etc) Calculate: see Marketing Attribution for more info on this.
- Notes and stories – just like blogging above, this metric is the anecdotal “quality over quantity” item.
Email Marketing KPIs Examples:
Having a newsletter is an important part of content marketing. It’s helpful to compare each of these example metrics to your average to see how you’re doing with each send.
- List Growth – this metric lets us know how quickly our list is growing. Calculate: [# of subscribers] – [# of subscribers last month] ÷ [# of subscribers last month] = Growth %
- Open Rate – this metric lets us know how effective our subject line is. Was it compelling? Did it make them want to open it? Calculate: [# of opened] ÷ [# of sent emails] = Open Rate %
- Click Rate – this metric usually lets us know how effective your call to action, email messaging, images, and content were. Did it make them click? Was it consistent with the subject line you wrote? Calculate: [# of clicks] ÷ [# of opens] = Click Rate % from Opens
- Unsubscribes – this metric tells us when people are unhappy – maybe your messaging was off, maybe they’re not interested anymore. Either way it’s more important to look at this in comparison with your average unsubscribe rate. Calculate: [# of unsubs] ÷ [# of sent] = Unsubscribe Rate %
- Desired Action – this metric tells us how effective we were at getting our subscribers to do something. For example: buy something, visit something, sign up for something etc. You won’t find this one as neatly organized in your email marketing provider reporting dashboard. Example: Mailchimp does have Goals now, but you might want to create this one from some ad-hoc research. Calculate: [# of Desired Actions] ÷ [# of sent] = Desired Action Rate %
Business Metrics Examples:
The final group of metrics that might be relevant to you are all about your business. It might be more about sales if you have a product; revenue and users if you have a service; billable hours or close rate if you are a freelancer etc.
- Total Revenue
- Total Expenses
- Net Profit
- Profit Margin
- Deals Closed/Sales
- Billable Hours/Non Billable Hours
No matter what metrics you decide to track and what you pick as your KPI, just remember that you can always change it later. So begin! And if next month you decide to track something else, do that! One of the great things about Google Analytics is that you can usually go research past metrics, so it’s not too hard to re-focus your efforts.
What metrics and KPIs do you track?
This is Part V in a series on Metrics + Measurement for Beginners. Start at the beginning with How to Measure Success of Your Marketing Campaigns.
Like saving time?
Get your own Fill-in-the-Blank Marketing KPI Dashboard – a spreadsheet download that includes: ROI Calculator, Sample Marketing Campaign Results Generator, Marketing Campaign ROI Tracker, and Monthly/Weekly Metrics Dashboards.