This is Part II in a series on Metrics + Measurement for Beginners. Start at the beginning with How to Measure Success of Your Marketing Campaigns.
We’ve figured out the what and why of our marketing campaign with measuring success (goal, idea, desired action, success, measure). The next step deals more with the “how” – estimating expected results. Do we have a way to know what our reach and return might be in advance? If we can do a little bit of this work up front, we’ll not only have an idea of which of our ideas to pursue first, but we can also have some estimate of what will happen when we do.
This brings us to the sample Campaign Results Generator. Oh look a spreadsheet! We can use the Sample Campaign Results Generator to calculate Return on Investment (ROI) and track how many Impressions (eyeballs), clicks etc. that we will need to even garner any sales based on our current conversion rates and margins. Accounting 101 deja-vu? Calculating return has a place in marketing.
How many people might we have to show our ad (Impressions) to to get just one sale (revenue)? 200? 2,000? This is our conversion rate. That’s not the end though. Given how much we have to pay to make whatever we’re selling and how much we’re paying for the ads what’s our return then?
ROI Calculator
The regular definition of how to calculate ROI from the finance world is: ROI = (profit – expense) / expense.
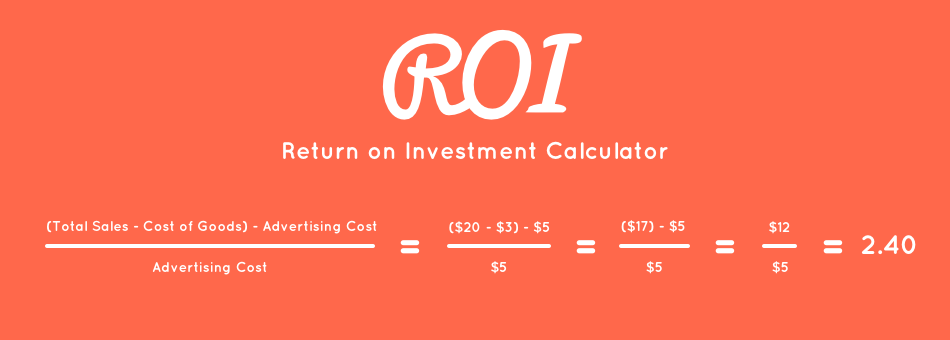
Return on Investment (ROI) calculations can seem pretty confusing. In the marketing world, a more common acronym is ROAS – Return on Advertising Spent. ROAS = (Sales revenue – advertising cost) / advertising cost. The issue with only looking at ROAS is that it doesn’t take into account our cost of goods (COGS). Even if we’re selling a digital product, we have some cost to create, host, etc that product.
It can get a little complicated when we start figuring out what falls under profit and expense, but it’s a much clearer picture of what’s really happening than ROAS. Here’s an example: Let’s say we sold our artisanal marshmallow pack for $20. We had to spend $5 in order to make that sale. If we were just using ROAS as our guide, we would say our ROAS was 3. But we’re missing a big piece of the picture. What was the cost to make those marshmallows? If it cost us $3 in materials to make the marshmallows, or $17 our ROAS would still be 3. However, our ROI would -.4 if our product cost was $17 and 2.4 if our product cost was $3. That’s a huge difference – the difference of profitable vs unprofitable. If we had simply looked at our ROAS, we would think we were making money either way. That’s bad. If you want to use ROAS for simplicity in Adwords etc., make sure you know at what ROAS you’re hitting breakeven (2, 3 etc. depending on your profit margins).
Fill-in-the-Blank Template – Campaign Results Generator
It’s not complicated if you have a spreadsheet auto-calculating it all for you. With my Sample Campaign Results Generator spreadsheet, you just start plugging in some numbers and it will auto-calculate the rest for you. Buy Now for $20 or spend a few hours creating your own spreadsheet with the following data.
Here’s what info we need:
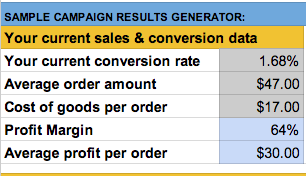 Your current conversion rate. A general rule of thumb for e-commerce is 1%, This can vary like crazy. If you don’t have conversion tracking set up on in Google Analytics, here’s how to get started the simple way with Goals.
- Average order amount. You probably already know this. Just have one product, or a digital product? Done! If not, this is another you can estimate based on Google Analytics or your own accounting records.
- Cost of goods or profit margin. This helps us identify at what point you’re spinning your wheels. Digital product? It’s probably pretty high. 80-90%. Retail, maybe 20-60%. Again, this is something you probably already know from your accountant, but should be a part of your marketing.
Once we have average conversion rate, order amount, and profit margin, we can generate Return estimates, with all the estimated data from ad platforms likes AdWords or Facebook ads.
Channel data estimates:
- Impressions: we’ll input a range of examples, so we’ll try 5k, 20k, 50k, 83k
- Ad Click through Rate % (CTR): our channel might give us some estimates, so enter those here. We’ll try .5%, 1%, 2.5%, 3%, 4.5%
- Average Cost per Click (CPC): this is another thing our channel gave us some estimates for: $.55, $.2 , $.35 etc.
Based on all that, we can calculate the following:
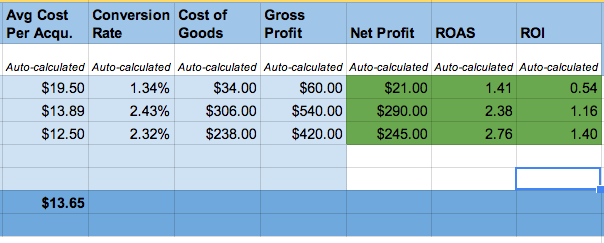
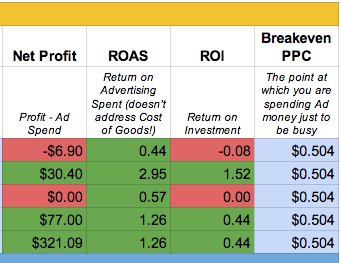 Clicks = Impressions * CTR = we can find out how many clicks we might get based off their estimates for us.
- Total Ad Spend = Clicks * Avg CPC = we can find out how much we might spend if we just let it go on auto-pilot.
- Sales = Clicks * Conversion Rate = we can found out how many orders we might get.
- Gross Profit = Sales – Cost of Goods = This is how much you’re making.
- Net Profit = Profit – Ad Spend = This is how much you’re actually making, taking into account advertising spend.
- BreakEven PPC = Profit / Clicks = This is the average PPC that you’re just getting by on.
- ROAS = your return on advertising spent = This doesn’t address cost of goods.
- ROI = your return on investment.
Once you have some of these variables estimated, you can start messing with numbers to see how much one change impacts everything else. Maybe getting a lower CPC doesn’t have that much of an impact, maybe the CTR rate does, maybe you need to work on overall conversion on your site, So many different variables. And what’s important about playing with this stuff while estimating is then you know when you are collecting actual data (results = past tense), it helps you to know what happened, and have a more accurate moving projection as time goes on.
When to use the Sample Campaign Results Generator:
- Paid search advertising campaigns: Google Adwords, Bing etc.
- Social media advertising: Facebook ads, Twitter ads etc.
- Email marketing campaigns
- Advertising partnerships
Want to skip all the manual calculating and just input a few numbers? I’ve released this ROI template as part of my Fill-in-the-Blank Marketing KPI Dashboard – a spreadsheet download that includes: ROI Calculator, Sample Marketing Campaign Results Generator, Marketing Campaign ROI Tracker, and Monthly/Weekly Metrics Dashboards.
Buy Now for $20.
This is Part II in a series on Metrics + Measurement for Beginners. In the next part of this series, we’ll take a look at collecting actual data from campaigns, analyzing what actually happened, why, and what we might change going forward. Read Part I.