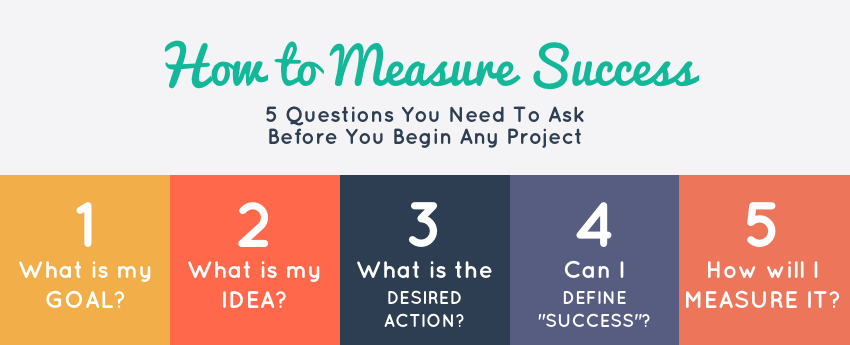
KPI Template is Part III in a series on Metrics + Measurement for Beginners. Start at the beginning with How to Measure Success of Your Marketing Campaigns.
After settling on our goals and making some estimates, the next step of measuring our marketing campaign is all about taking action. Start the campaign, keeping in mind the goals and ideas we talked about in step one and step two. Then, we’ll keep an eye on what’s happening and record our results. If we already have some stats to look at (from a previous campaign or if we’ve been running this one for a few days), we’ll collect that recent data. After entering in our new-found data, our KPI template will help us find out what’s actually happening, why, and what we might want to change going forward. Save yourself some time and buy my template for $20 or build your own with all the data I suggest here and in this tutorial).
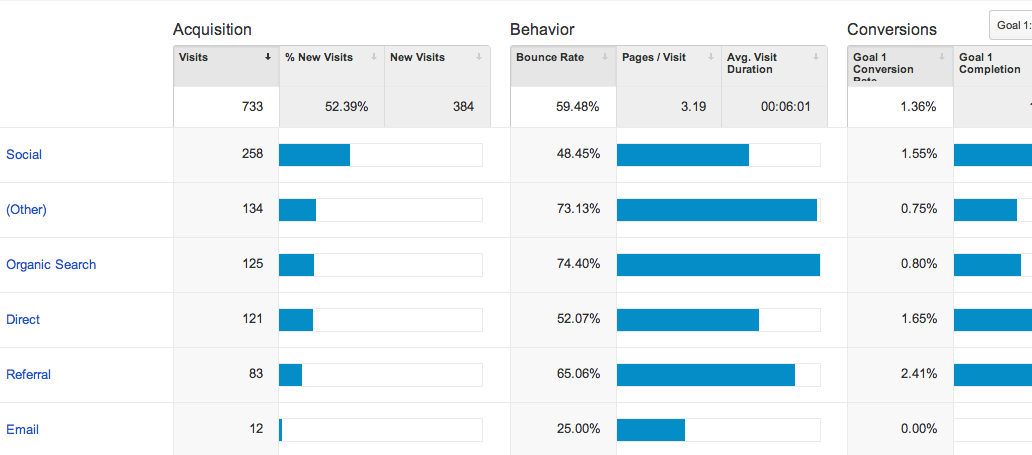
Most reporting dashboards (AdWords, Mailchimp, Facebook Ads, Twitter Ads etc.) have some variation of marketing metrics helping us analyze ROI, but when we’re able to standardize it and keep it in one area that we look at on a frequent basis (like a Marketing KPI spreadsheet), it can be easier to start learning and doing – taking action off these metrics.
Ad Analysis – Collecting Actionable Data for a KPI Template:
We’ll continue to use the example of advertising on AdWords for this tutorial.
Step 1. Choose a time period:
First, we’ll start with the time period that we’re measuring. If you’re just starting a campaign, you’ll probably find it useful to collect daily stats at first. Then moving to weekly or as needed over time, and monthly stats can also give you a valuable look at the bigger picture of how your campaign is performing.
For this example, we’ll use a one week time period. For weekly reporting, I have always preferred a Monday – Sunday format as it keeps the weekends tied together in the same reporting week. This can be more helpful for trending and understanding what’s happening.
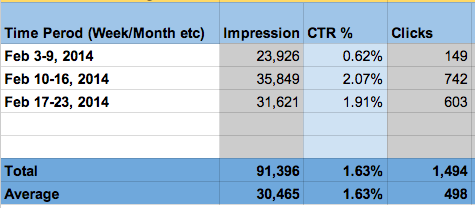
Step 2. Collect Impressions, Clicks, and Ad Spend:
Collect from: Google AdWords
Next, we’ll add in the Impressions and Clicks, and how much we spent.
Step 3. Collect Sales Revenue and Orders #s:
Collect from: Google Analytics or your accounting info
Then, we’ll add in how many sales are attributable to this channel (from Google Analytics) and the revenue (Analytics or our accounting software).
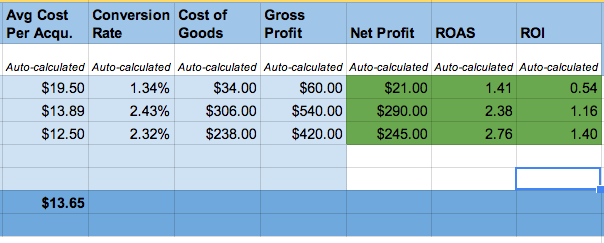
Step 4. Analysis: how does ROI, ROAS, and volume look in your KPI Template?
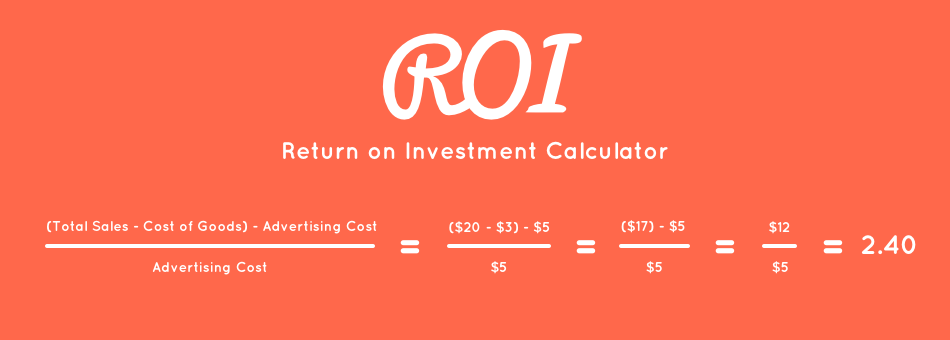
After inputting the previous information, we should have some metrics to look at for both Return on Advertising Spent (ROAS) and Return on Investment (ROI). For ROI, anything under 0, means we’re losing money. 1.15, means that for every $1 we spend, we’re bringing home $1.15. At breakeven, we’re just spending money to be busy, which from a branding perspective, is not always a terrible place to be. Remember, it needs to come back to our goals. Part of the reason we articulated our goals in Part 1 of this series was so we knew what a success would look like, versus just deciding that whatever is happening is apparently fine.
When it comes to ROI, clearly, we’d like to see it as high as possible, but part of experimenting is playing a bit. Additionally, if we’re on a small campaign budget or in a small niche, the numbers and sales for the first couple of weeks might not be enough to know a for sure “yes, continue”/“No, stop.”
Another thing to analyze is the overall volume of the campaign. Are we seeing sales revenue in the tens? hundreds? thousands? How has our average cost per click, conversion rate, cost per acquisition, and profit changed? Where is the happy point on the spectrum between higher profit and higher volume?
Step 5. What should we change?
After we have a look at what happened (past tense), it can give us ideas for what to change. Where do we go from here? What are some things that we might test along the way? Here are some ideas (both for AdWords and other advertising platforms):
- change your ad copy
- increase/decrease bids
- add negative keywords
- time/day parting
- more targeted longer tail keywords
- less targeted general keywords
- re-targeting
- try different regions/countries/local
- “friends of page likers” only campaign (Facebook)
- boosting your social campaign with targeted ads
- try Twitter cards (for emails, clicks, follows etc)
Measuring non-traditional campaigns (email, social etc.)
What about campaigns that aren’t traditional advertising methods? For an email newsletter, or social media, you can use the same kind of dashboard, Impressions could be followers and clicks or incoming traffic from that network, an engagement rate, expense (if contracting out or estimating your hours), and revenue you could list any that social was a touch point. For an email newsletter, you would add in things like total emails sent, clicks, click-through rate, clicks per user, unsubscribes, desired actions completed, conversion rate % off the desired action, unsubscribe rate etc. Stay tuned, in Part Five of this series we’ll dig into kpis and analyzing trickier campaigns.
How did you do? Questions? Leave them in the comments below!
In the next part of this series, we’ll take a look at marketing attribution – meaning how do you decide what channel or campaign impacted the sale when several channels (social, email, AdWords, search etc.) “touched” it?
Like saving time?
Get your own Fill-in-the-Blank Marketing KPI Dashboard – a kpi template download that includes: ROI Calculator, Sample Marketing Campaign Results Generator, Marketing Campaign ROI Tracker, and Monthly/Weekly Metrics Dashboards.