This is Part IV in a series on Metrics + Measurement for Beginners. Start at the beginning with How to Measure Success of Your Marketing Campaigns.

A few years ago, I was on the hunt for a new bike. I looked at bike shops, read blogs, searched for reviews, and asked friends. Then I saw a blog post about really colorful bikes from a brand I hadn’t heard of. I visited their website and noticed the prices were really cheap. A few days later I searched on Google and found the site again. The next week, I asked a local bike shop about the quality. I spent another week looking at pictures and comparing the components to other bikes and looked on Google Shopping. I finally bought the bike and had it assembled at my local bike shop. Yay!
No, this isn’t just a mediocre story about my bike shopping experience. Question>> What channel should get credit for my bike purchase? Previously, in that scenario, Google Shopping would have gotten the credit as it was the last interaction before the sale (conversion). We all know that’s not the full picture, and thankfully in Google Analytics you can use their Attribution tool to see a different perspective.
Attribution in an artistic sense can be mean crediting someone with something. In analytics, it’s the same idea. Readers often visit a site several times before signing up for your newsletter or many times before making a purchase. Marketing attribution is about what channel (search, social etc.) gets credit for that desired action. And how it was helped along the way by other channels.
One of the things that have been plaguing awesome social media and community managers for years now is attribution. Yes, the ones who are intuitively good at their job, but haven’t bridged the gap on metrics, or are just starting out with metrics. Most often there’s not an immediate “return” (monetary) on social media. So while vanity stats (X Amount of Followers), and Engagement Stats (X % of our followers liked or clicked or commented), might look great, when it comes down to the business team – they might report that Social was the lowest revenue generating channel and Content was just slightly better, and that paid advertising was really high. Guess what? This isn’t surprising.
As a social or content manager might know, but not know how to articulate -that’s not the whole picture! A more recent way that makes a lot of sense for companies with an online presence is measuring Attribution. Attribution meaning – who do we attribute this sale too? First touch? Last touch? How does it look from a more holistic perspective (multi-channel)?
Why should you care? If you know the length of your sales funnel, and if you can learn over time what your attribution is from “first touch” (they saw you on Twitter and clicked through to your site), to last touch (they received your email newsletter and then bought something), that’s seeing more of the big picture.
After you’re able to develop some baselines on your attribution, you can start seeing where allocating staffing and resources to different areas of your business makes sense. Maybe you’re small enough still that it doesn’t make sense for you to hire a full-time community manager and a full-time editor; maybe you’re at the point that it makes sense to hire a full-time editor/community manager; or a full-time editor and part-time community manager, or vice versa, or maybe you have a team of editors and social media and email marketers, or maybe you focus more on paid search or SEO. Either way, here are some ideas for ways to get started with Attribution In Google Analytics.
5 Reports in Google Analytics for Getting Started with Attribution:
Attribution is one of the most overlooked reporting areas in Google Analytics. If you don’t have any goals (or Ecommerce tracking) set up in Analytics, you won’t see anything in the reports, so check out how to set up goals in Analytics if you haven’t done that yet.
1. Multi-Channel Funnel – or – Where do repeat visitors come from?
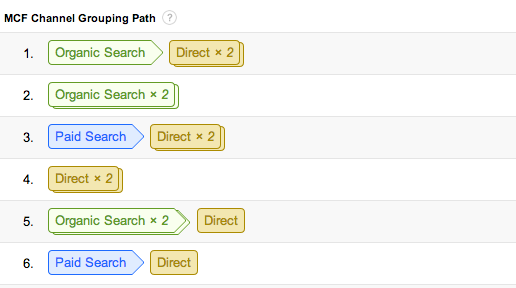
Find it in: Conversions>>Multi-Channel Funnels>>Top Conversion Paths
Most people don’t “convert” (signup for your newsletter, buy something etc.) on the first visit to your site. (Pssst, but sometimes visitors do sign up on the first visit – especially if you have a solid signup bonus). You can look at the top conversion paths on a basis of by channel or check out the paths that are 2 or more legs long. For example, organic search followed by direct. This lets you know where people are finding you and then returning. This can be a big win for social and content.
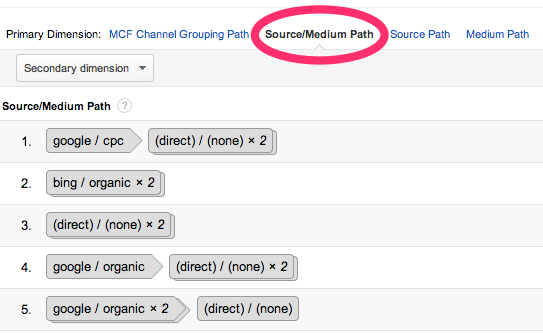
Click on Source Path to see more detail of the source path (google / cpc, google / organic) and the urls of websites referring (people linking to you, facebook.com, t.co twitter links etc.). This is a great opportunity to see inbound links from outreach activities (like guest posting) that are actually making a difference on your community!
Action Item #1: What are your most popular 2 and 3 leg paths? (My top paths are Organic Search>Direct, Referral>Direct, and Social Network>Direct). And when you click on “Source/Medium Path”, what websites or social networks specifically are generating the most conversions? (my top converting sources are Twitter, Google search, and a few incoming blog mention links). Think about how your communication style varies in different channels and stages of the funnel.
2. Time Delay – or- How many days does it take for people to convert?
Find it in: Conversions>>Multi-Channel Funnels>>Time Lag
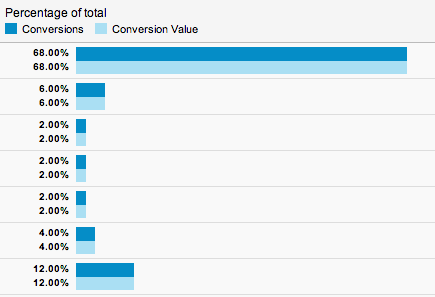
Next, let’s take a look at how long it takes for people to convert, on average. If you have more than one goal set up in Google Analytics, you can select either or all, and then see the time lag in days in the chart. While the total number of conversions is interesting, the Percentage of Total chart on the right might give you a better feel for time. Example: 85% in 0 days (probably immediate), 2% in 3 days, 5% in 2-3 months etc.
Action Item #2: What’s your average? How many days on average does it take for people to convert? Is there a way you could lower the average? Does it feel natural?
3. Path Length – or – How many interactions with you does it take for people to convert?
Find it in: Conversions>>Multi-Channel Funnels>>Path Length
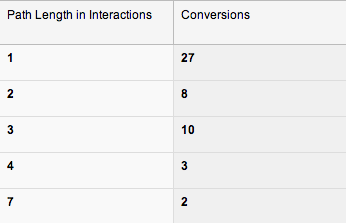
The next related view is Path Length. If the majority of your conversions are immediate (0 days), then your path length is probably one or two interactions. Just like the “how many days” item above, this can give you a lot of insight into your user experience. Do people sign up for your newsletter on the first visit, and then not buy for five or six sessions? How can you keep some of this data in mind when you’re crafting copy or your newsletters?
Action Item #3: What’s your average path length? If you have a newsletter and sell things, how do the two differ?
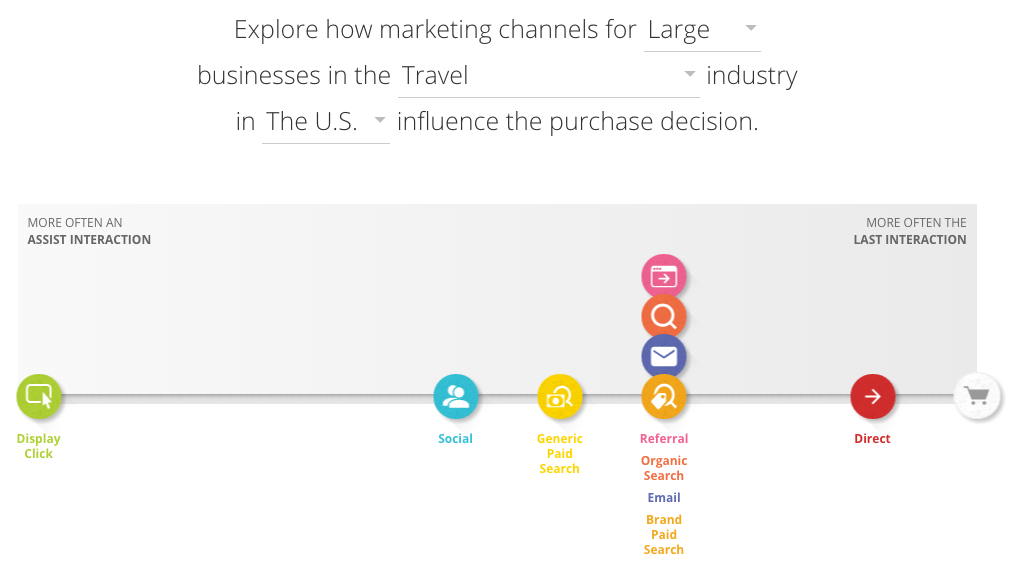
4. First Interaction vs Last Interaction – or – What’s growing awareness and what’s closing the sale?
Find it in: Conversions>>Attribution>>Model Comparison Tool
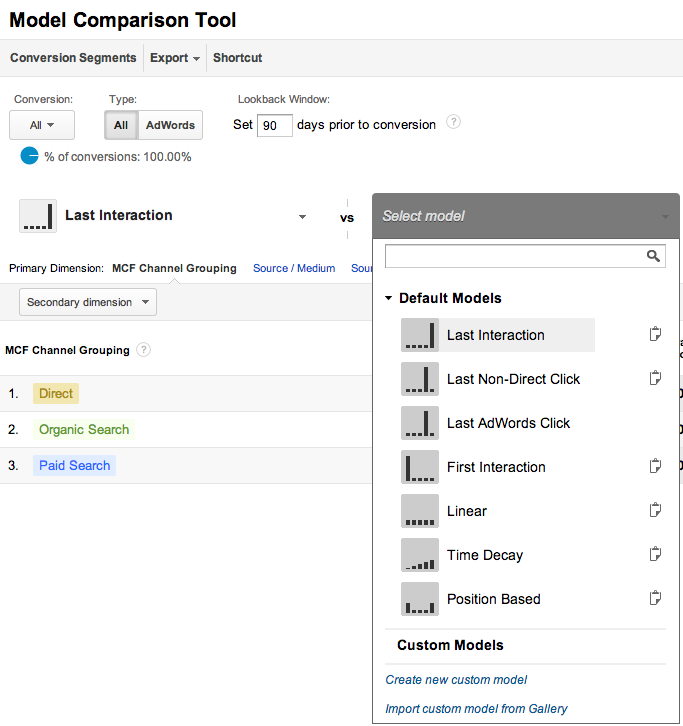
The Attribution Model Comparison Tool lets you put different models – like First Interaction vs Last Interaction – side by side.
Think of First Interaction as how you’re growing awareness – what sales people like to call the “top end of the funnel.” Now, if you sort by First Interaction, you’ll see channels that are building awareness, while sorting by Last Interaction will probably shuffle the order, since “closers” will be at the top.
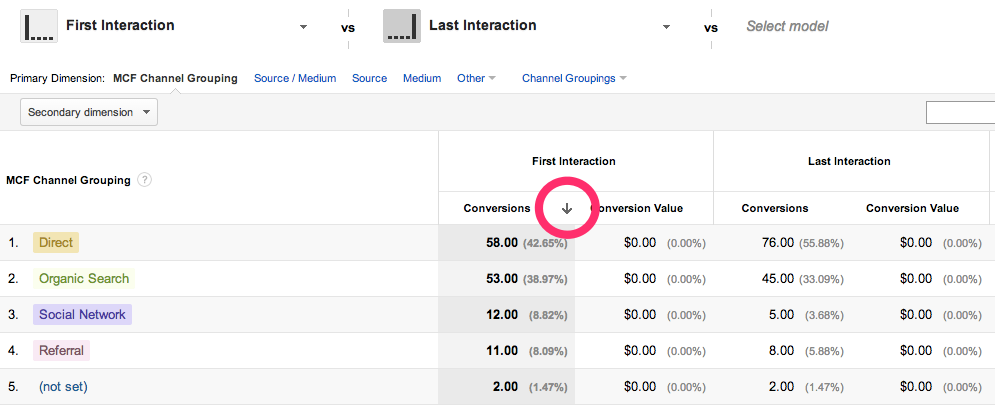
This is useful, but what’s even more useful is digging a little deeper to see what specific channels and urls in the “channel grouping” it’s talking about.
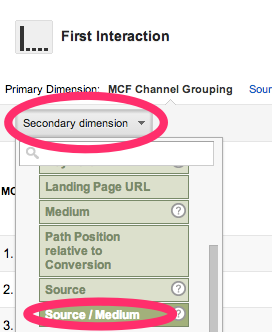
Click the “Secondary dimension” drop down on the left and then click >Acquisition and select the green “Source / Medium” option. This adds a second column to the table and shows you what specific Source (Direct, Google, Bing, Facebook etc) and Medium (organic, referral etc.) converted on a first or last interaction basis. Wow! Information!

Action Item #4: What channel is your top First Interaction when it comes to conversions? What channel is your top Last Interactions?
5. Assisted Conversions – or – Who are the team players?
Find it in: Conversions>>Multi-Channel Funnels>>Assisted Conversions
Assisted Conversions can go deep pretty quickly. While it’s probably easiest to think about in from a sports perspective (soccer, basketball etc.) of teamwork, let’s try a party approach. Say you are throwing a party with friends – side note: they all have really weird names. One friend (Newsletter) makes the best drinks and another friend knows the best location (Adwords), and another friend (Twitter) has the best music, and another friend (Blogs) always invites a few really randomly interesting people. Now, who made the party awesome? Was it just Blogs – who invited the people to the party in the first place? Or was it Newsletter because they made so many awesome drinks that people ended up staying till way late? Or was it all Adwords doing because they were the last people to tell you thanks for coming as you left? OK, the analogy is over. Did it make sense?
So it goes First Interaction >>> All the Assists along the way >>> Last Interaction
There’s also a ratio on the far right that shows how a specific channel plays a part in conversion. Closer to zero means it does more converting than assisting, closer to 1 means it assists and converts. More than 1, the more it was an assistant.
Action Item #5: What channels play the biggest role in assisting vs First Interaction or Last (converting)?
Note: Some of the limits of attribution are the 90 day Lookback Window (what if they originally visited 120 days first) and cross-device access (first they find you on their iPhone, then they come back on their laptop for the second visit). This isn’t a reason to toss attribution out the window, just something to be aware of as you go.
Happy analyzing! Questions? Ideas? Leave them in the comments!
In the next part of this series, we’ll take a look at choosing metrics and KPIs that matter for your business.
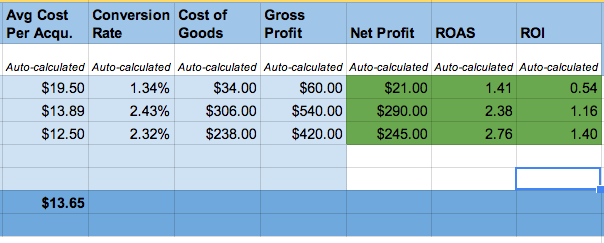
Like saving time?
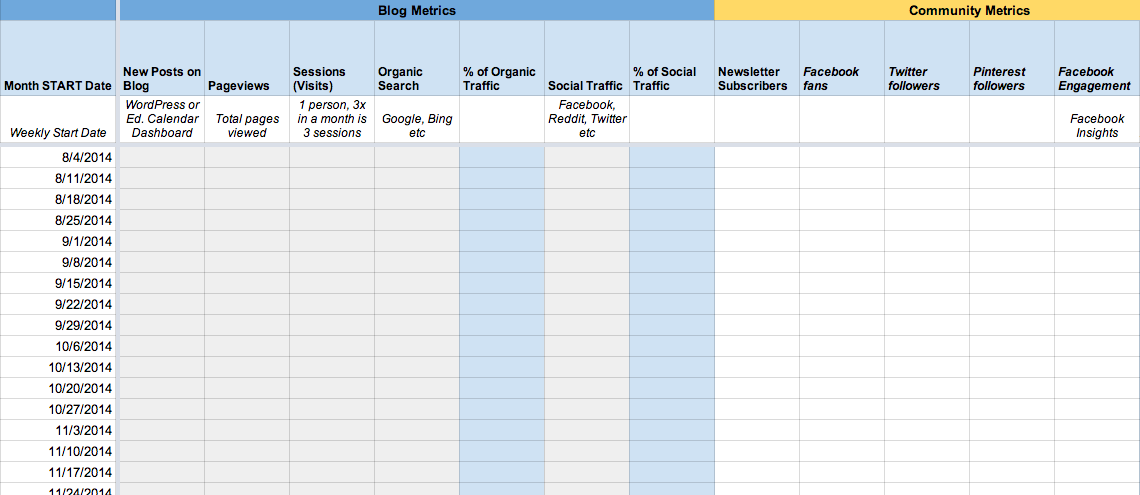
Get your own Fill-in-the-Blank Marketing KPI Dashboard – a spreadsheet download that includes: ROI Calculator, Sample Marketing Campaign Results Generator, Marketing Campaign ROI Tracker, and Monthly/Weekly Metrics Dashboards.